If you have been reading this blog for a while, you know something about how to interpret the various kinds of images and graphs we use to interpret the state of the tropical atmosphere and the MJO in particular. So today I will just give a few pictures without too much explanation, to indicate what is going on. It's quite exciting at the moment and there is a lot to see as the observations roll in hour by hour, so I don't want to spend a lot of time blogging. The bottom line is that the MJO is here in the Indian ocean. Below is the RMM phase space plot again. It shows that we are in early phase 2; this plot is already a couple of days out of date and so most likely we are further into phase 2 at this point.

Here is the Meteosat infrared satellite image (water vapor channel) as of 0930 UTC today. Notice the strong and widespread equatorial convection.


The circulation just south of Sri Lanka is actually forecast by some of the models to become a substantial tropical cyclone, which if true would likely make landfall in southern India in the next day or two. The one just northeast of Madagascar may become a tropical cyclone as well.
Now the local picture: it has been raining all day here in Addu. Here is what the S-Pol reflectivity map looks like as I write this:

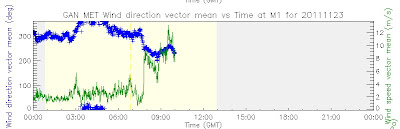
Now for a change let's look at the time series of surface wind observations for today, below. The blue is wind direction, with the scale on the left, in degrees. So zero degrees is wind from the east, 90 is from the north, 180 is from the west, etc. Wind speed is on the right, in meters per second. So what this plot shows is that at about 730 UTC - 1230 local time in Addu - our winds spiked up and shifted from southwesterly closer to westerly. Since then we have had winds of 10-12 m/s, which is 22-25 mph. At least from this one island, on this one day, it looks and feels like a "westerly wind burst", which is a classic indication of the MJO active phase. The fact that it keeps pouring doesn't do anything to diminish one's impression that that's what's going on.
It is interesting that there seemed to be little evidence of a sustained gradual moistening with this event that we saw with the previous event, at least none that I can see with my lack of filter.
ReplyDeleteWell... yes. It has certainly been fairly moist this last week or so, but maybe it wasn't as dry as the previous suppressed phase before that so there wasn't as much of a change...? There certainly did seem to be a gradual increase in the level of convective activity though.
ReplyDeleteI think a tricky issue is to define the right measure of moistness that incorporates horizontal structure appropriately as well as vertical structure. What is the right region over which to average?